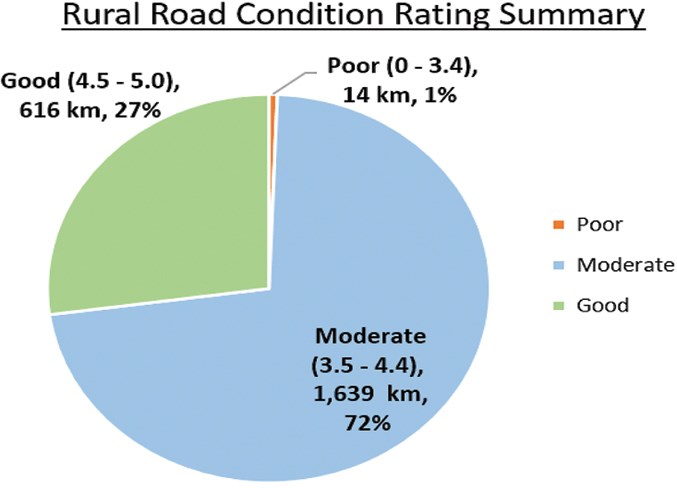
Ninety-nine per cent of Westlock County’s 2,305 kilometres of roads are ranked “moderate” or “good” according to a recently-released road study commissioned by the municipality.
Those findings are just some of the highlights included in a 20-page executive summary of a 614-page Westlock County 2018 Road Study report prepared by Stantec that councillors reviewed and unanimously accepted as information at their Nov. 13 meeting.
Budgeted at $100,000, with a final invoice yet to be received, the document serves as an update to the municipality’s 2001 road study and will form the basis for potential road rebuild/construction/shoulder pull candidates for the next decade. Notably, the report doesn’t cover the county’s ongoing road maintenance/gravelling programs and is intended as a big-picture view.
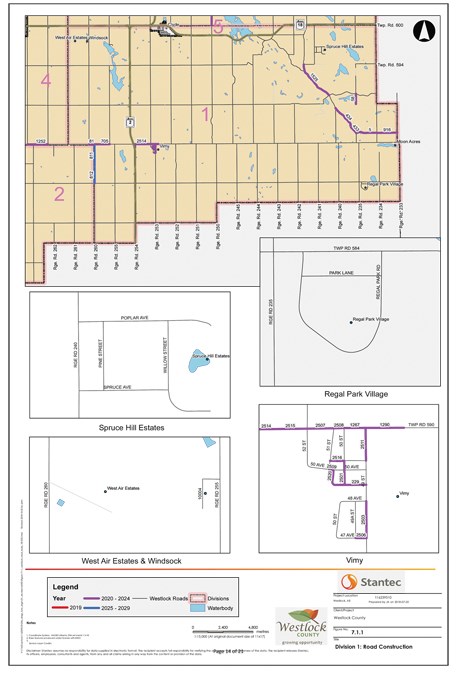 The 10-year priorities for Div. 1.
“As the results came back, I was a little surprised based on the feedback I’ve received over the two years I’ve been with Westlock County. This is actually a good news story for council and the county as a whole,” said infrastructure director Al Scott.
“I challenged myself, our transportation manager and operations supervisor to challenge the numbers as far as getting Stantec to back these up and prove them to us. Over the course of two or three meetings we went through the 614 pages of data and picked out ones we thought were a little worse than what they had come up with. When we went through the importance ratings and went through the condition ratings the numbers proved out true.
“Big-picture speaking, for what we have, the materials we had to build them in, the materials we’re using to maintain and upgrade them with, usage, for our particular area and our winter, our roads are in moderate shape.
“I fully stand behind the information that was gathered and collected.”
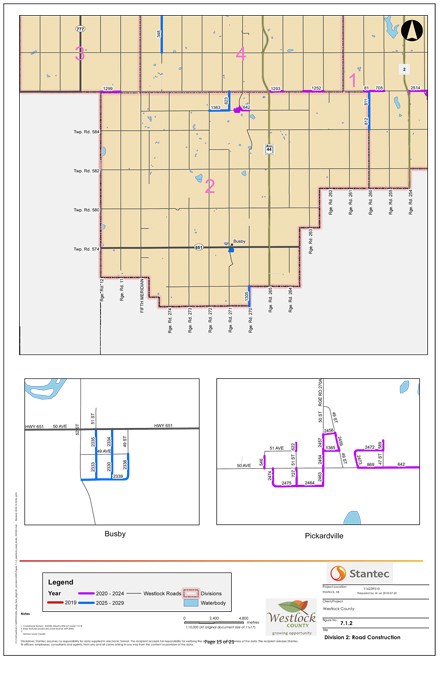 The 10-year priorities for Div. 2.
The report states that 72 per cent of rural roads (1,639 kilometres) are in moderate condition, while 27 per cent (616 kilometres) are good. Only 14 kilometres, or roughly one per cent, are classified as poor.
“Now there’s a range in moderate. If it’s a 3.5 that’s a moderate, while if it’s a 3.4 it is poor. There is a range … so when I say moderate that doesn’t mean that 72 per cent of our roads are all the same,” Scott noted.
Meanwhile, 30.1 kilometres of urban roads (82 per cent) are deemed moderate, while 6.4 kilometres (18 per cent) are classified as good.
“One thing that was important to me was that it had to be based in reality. I wasn’t interested in a document that said we needed to rip up every single road, or pave a bunch of roads that weren’t paved in the first place and spend a whole bunch of money that wouldn’t be available,” said Scott.
“We needed to look at the roads that we have as far as soil types and the conditions we experience in Westlock County. I wanted to focus on what we have and where we can go from here using the information collected.”
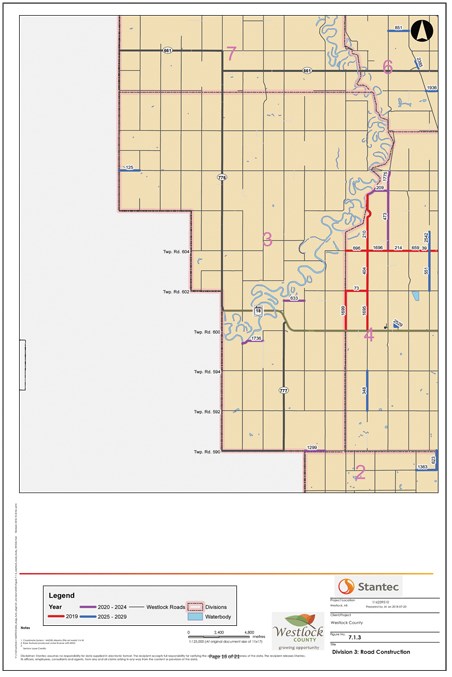 The 10-year priorities for Div. 3.
The document states that over the next 10 years, 115.1 kilometres of rural roads need improvements, while 13.4 kilometres of urban roads need work.
The report recommends $1,432,900 worth of construction work in 2019, followed by $1.403M annually from 2020 to 2024. In years 2025 to 2029, the report recommends spending $1,339,450 per year.
“We looked at our importance and condition ratings and went back to the data we collected and we came up with a 10-year construction plan that mimics what the county has traditionally been spending on shoulder pulls — about $1 million to a $1.5 million a year,” said Scott.
The report and the rankings
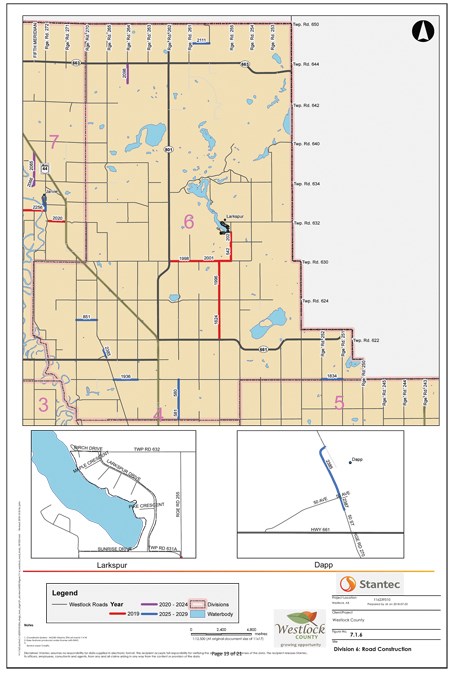
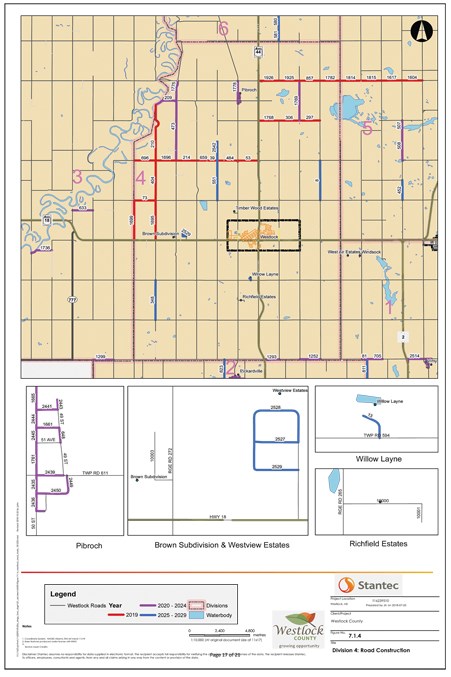 The 10-year priorities for Div. 4.
Stantec, which was one of nine companies to bid on the report, was tasked with reviewing all the county’s roads, ranking them to determine which required upgrades and then prioritized them.
They were also tasked with providing projected road maintenance costs for the next 10 years and to identify alternative maintenance methods for gravel and paved roads.
Rural roads were broken down into three categories: local (1,802 kilometres gravel, 7.6 kilometres hard surface), collector (316.1 kilometres gravel, 10.5 kilometres hard surface) and arterial (109.4 kilometres gravel, 22.7 kilometres hard surface).
Local is defined as roads providing access to residences and fields; collector provides connectivity between major and local roads; arterial provides primary connectivity between highways and communities.
Urban roads in the hamlets and subdivisions (17.6 kilometres gravel, 19.1 kilometres hard surface) were also covered.
The proposed road rehabilitation projects, provided in the accompanying seven division maps, were selected using two measures — importance and condition.
Condition, ranked one (poor) to five (good), was based on the road’s structure, gravelling required and its surface drainage and width. The vertical and horizontal alignments were also graded as well as the side slope, ditch drainage, brushing and drainage issues. For example, if 75 per cent of the road of was in good condition it received four points, whereas if 50 per cent of the road was in good condition it got three.
Importance of the road, again on a scale of one to five, was determined by road counts, the percentages of trucks, proximity to parallel primary or secondary highways, continuity and the mix of industry/commodity usage.
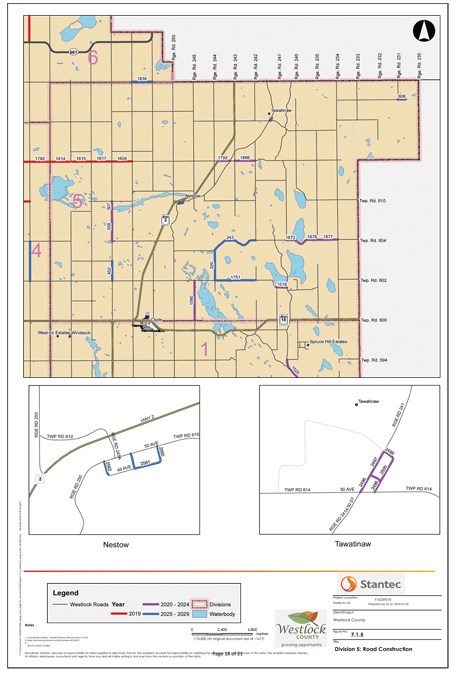 The 10-year priorities for Div. 5.
All of the roads were evaluated by the same pair of Stantec employees who drove them June 12-22. Their grading was done on one-mile stretches, meaning a bad 50-metre portion, or random pothole, wouldn’t lead to an automatic fail.
Using those measures each was ranked in order to prioritize construction, with lower ranked roads placed before the higher ranked ones.
Red lines on the accompanying maps indicate 2019 priorities, while purple highlights 2020-2024 projects and blue covering the years 2025-2029. The numbers placed on the highlighted sections were generated out of the county’s GIS and give each section a unique identifier, Scott explained.
“We originally had these roads set up in individual years and then we went back and thought, does that make sense to pick specific years?” said Scott. “We decided to choose four-year spreads to give us and council some options as far funding is concerned and where we want to spend our money.”
Select pictures of roads (not identified by location) in poor, moderate and good condition, as well as their numeric rankings, are included on pages 6-13 of the executive summary.
Council reaction
 The 10-year priorities for Div. 6.
While accepting the document and appreciative of administration’s work, councillors also stressed the fact that the report is meant to provide a current overview as well as a long-term vision and doesn’t take into account ongoing work needed to address potholes, or other deficiencies.
“This is a good starting point for sure and gives us a good idea of what our roads are like in the county. I found it very informative,” said reeve Lou Hall. “Most of our roads are in moderate condition, but depending on the weather (and how it affects condition), that determines what somebody thinks about their particular part of the road.”
Added Coun. Darrell Osmond: “I think the report is put together very well. It gives a lot of information and to me it gives us what we were looking … a poor road is a poor road no matter how many people travel on it.”
The executive summary will be posted to the county’s website, while the main report, which offers specific details on road segments, may be available to the public — Scott said he would take direction from the CAO and council on whether to release that data.
“Within those 614 pages of data those sections of (bad) roads, whether it be 50 metres or 100 metres, are identified,” said Scott, noting the segments are broken up at one-mile increments.
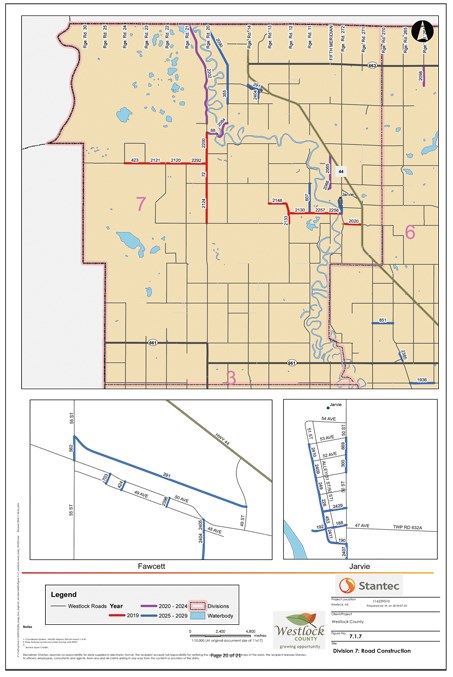 The 10-year priorities for Div. 7.